
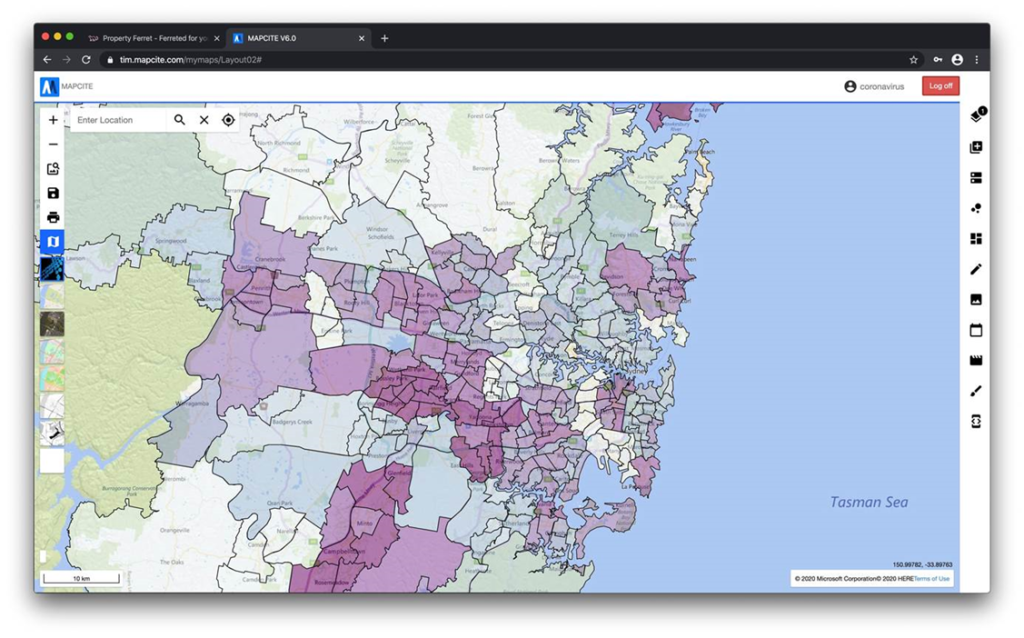
The clearest examples of using geospatial data harmonisation and visualisation capabilities to assess and manage risk is in the insurance sector. There is a delicate balance between premium charges and risk for all insurance companies, with a compelling need to “get it right” in order to ensure profitability, liquidity, sustainability, and longevity.
In assessing commercial property risk for example, the degree to which any insurance underwriter holds cover on the buildings surrounding a proposed new building policy, is important. Insurers do not want to be holding “concentrations” of risk exposure in any single area. That greatly increases the maximum probable loss as a result of an event in that area. The following image is such an example showing an insurer’s holdings in central Sydney.
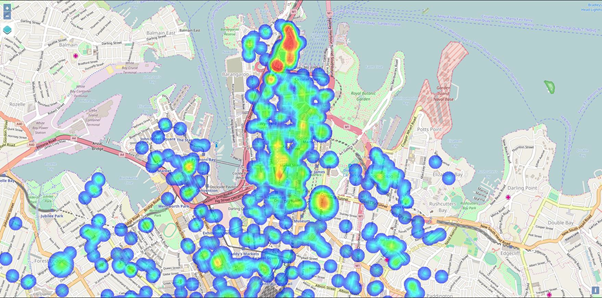
The red highlights areas of concentrated holdings, with blue less so, and green being relatively clear of holdings and exposure. It is therefore quite easy to see in the centre of the map, where this insurer should be looking to write more business. However, please now look at the following image.
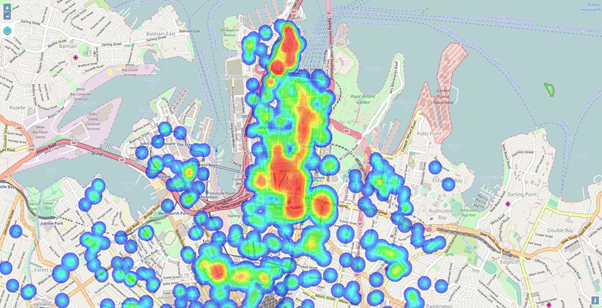
From this image it can now be seen that the previous green areas of potential increased business have now become red, indicating high risk exposure; so what changed? The change was brought about by merely harmonising Mapcite’s global terror target data set with the insurer’s current holdings. This relatively simple addition of a single, but highly relevant, data set has substantially changed the risk profile. From this greater insight the insurer can more accurately price, or even refuse, insurance coverage.
One of Mapcite’s global insurance customers is doing just this using multiple data sets and associated visualisations including the terror targets data set, historical records of earthquakes and other climatic events, and potential impacts from climate change. In these days of COVID-19, one of the newer key data sets could well be areas of high mortality risk due to age and health demographics. Without this information, an insurer might be confidently writing new business interruption and denial of access cover for a commercial building in the middle of an area most likely to be shut down first in the event of a COVID-19 outbreak!
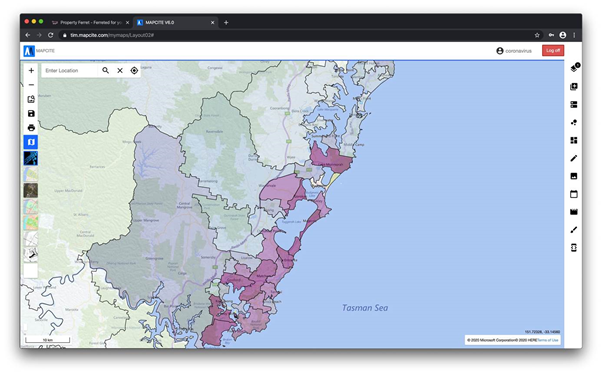
The image below shows such a high COVID-19 mortality visualisation for the Central Coast of NSW.
Author: Stephen Walker, GM Centre of Excellence for Geospatial in Australia